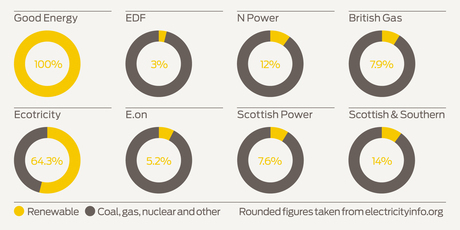
Graph from Good Energy, illustrating fuel mix for some UK energy providers
I rather like this graph from energy provider Good Energy, which shows the renewable/traditional mix for a handful of their UK competitors. It turns out that this data has been made publicly available in the UK since 2005, some of which has been documented on this public-interest site. That site looks at the mix per supplier, but only plots it on an individual supplier basis. It would be great if, using up-to-date figures, the renewables consumption of multiple suppliers could be compared against time. Some suppliers will increase it every year, and others won’t make an effort at all. Such a graph – perhaps powered by Flot or Raphaël – would make visualisation easy.
I’ve come across this supplier, who helpfully offer annual data of their fuel mix over time. I’ll see if others do this too – it’ll give some interesting data to plot.
Update 2 June
I thought this would be interesting to try, so here’s an initial graph of Ecotricity and Good Energy data, with source code. It’s powered by SQLite, and uses Flotr2 for rendering and jQuery for event handling. Tested on FF21 on OSX 10.6.8.